General
The Dashboard is designed to provide a snapshot overview of system performances for the last 24 hours. The Dashboard uses a grid layout and is driven by the current Tree context. By default, essential information is enabled for the left most columns.
This view is be shown to users who have not yet customised their Dashboard.
The Dashboard is user configurable and clicking the spanner icon in the far right corner allows a mixture of numeric statistics of various metrics (such as P1, P2, P3 etc.), informational graphics such as Sparklines, and battery info to be displayed. Of special interest are 28 day Nightline, 28 day Total Daily Flow, and Netflow features.
The Dashboard includes sorting and navigation features that give the user a useful overview of their entire oNet estate and provide easy access to further details.
Ordering and filtering
- The Dashboard shows child Areas and Locations of the tree node which has been clicked.
- The Dashboard reflects the tree filtering state. For instance, on the tree it is possible to filter to show only DMAs.
- The Dashboard honours the tree’s active/inactive filtering state for locations and areas.
- Clicking the column headers enables sort by that field.
- The Column positions can be re-ordered by dragging and dropping the header fields.
Hyperlinks
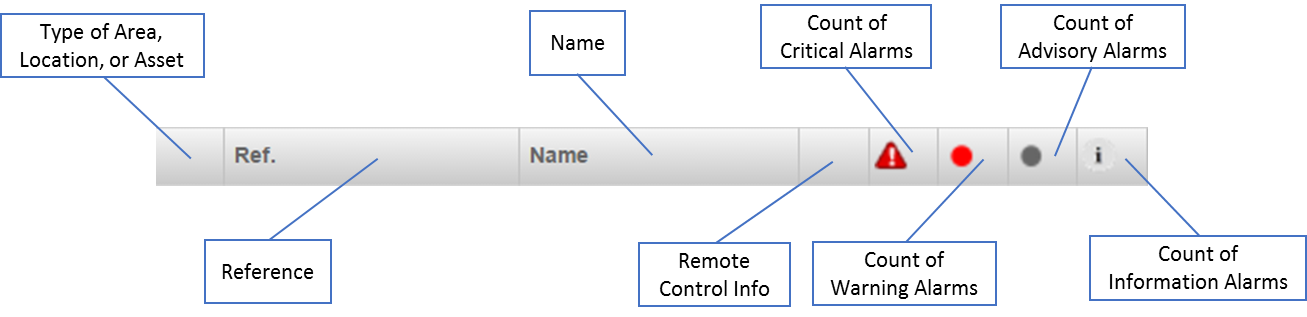
- Clicking on alarm values takes the user to the alarm display for that area
- Clicking on the area name or area reference takes the user to the dashboard for that area
- Clicking on the sparkline takes the user to the graph for that area
- Clicking on the Remote Control info takes the user to Control settings for that location.
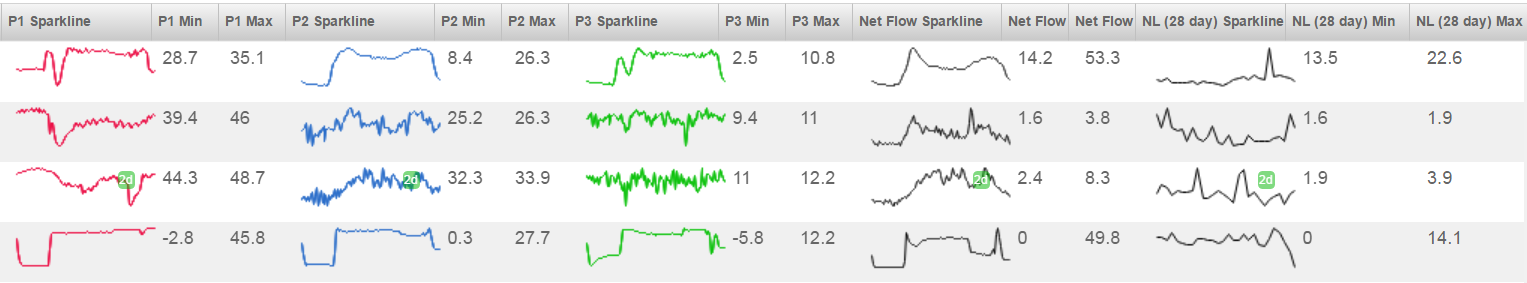
Sparklines
- Sparklines display the last full calendar day of 15-minute interval data at location time.
- Multipoint locations are aggregated to show minimum, maximum, and average data.
- Data age indicator “2d” appears if the aggregated data is older than ‘yesterday’ and shows the age in days.
- Nightline calculation is based on Netflow and sparklines span 28 days. • Statistical values for Min, Max, and Average appear adjacent to the sparkline.
Comments
0 comments
Please sign in to leave a comment.